Nolichucky Associates

Data Analytics for the Performing Arts

Nolichucky Associates

tony@nolichuckyassociates.com
nolichuckyassociates.com
linkedin.com/in/anthonymsmith

Every performing arts presenter has more useful data than they're using. Nolichucky Associates connects what you already have — ticketing, donor records, audience surveys — and turns it into working knowledge that helps you fill houses, retain patrons, raise more, and plan ahead with confidence. We deliver outputs your staff can use on Monday morning, not dashboards no one opens.

Case Study 01

Know Every Patron, Not Just the Frequent Ones

Patron Segmentation · Data Integration

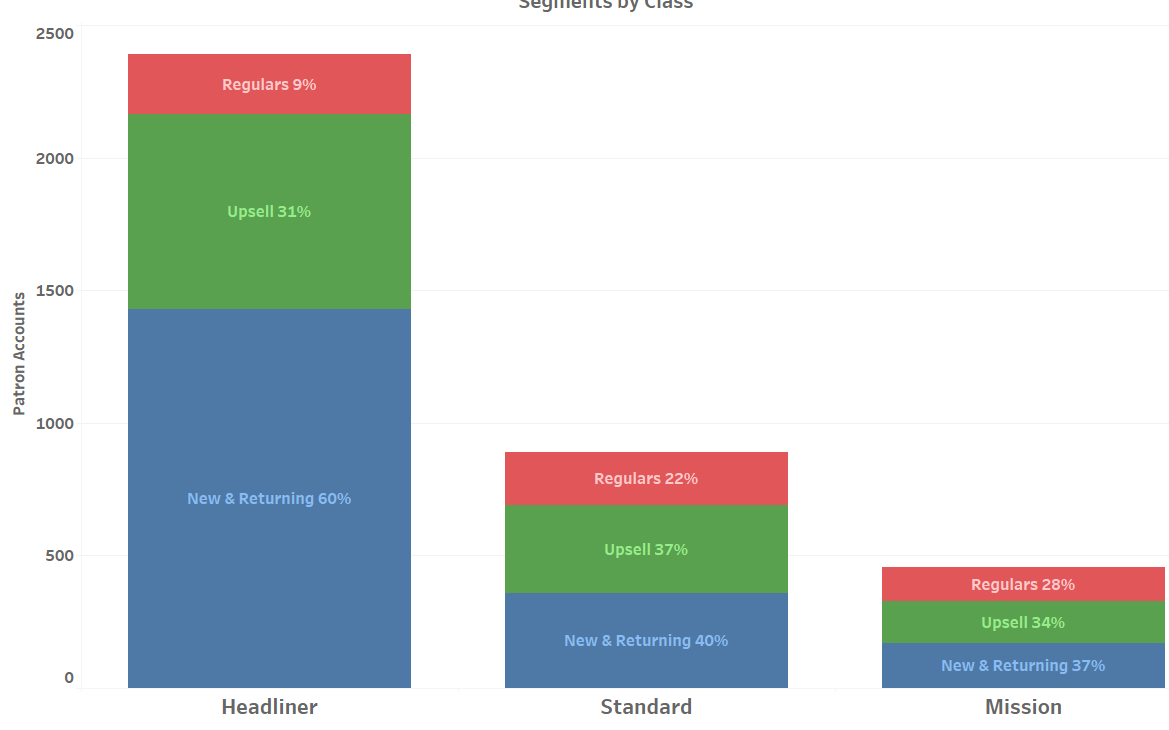
Bring ticketing, donor, and CRM records together so every patron has a single story — lifecycle stage, genre preference, region, and engagement trend.

Result: A patron file your team can sort and act on by segment, genre, region, or giving potential.
Case Study 02

Spend Fundraising Hours Where They Count

Donor Targeting · Renewal & Upgrade

A ranked weekly call list — donors and prospects scored by likelihood to give, when they give, and how much they could grow. Surfaces strong candidates hiding in your ticket buyers.

Result: Personal outreach focused on the right people each week. Campaign response becomes trackable.
Case Study 03

See Where Your Audience Lives

Audience Geography · Marketing Strategy

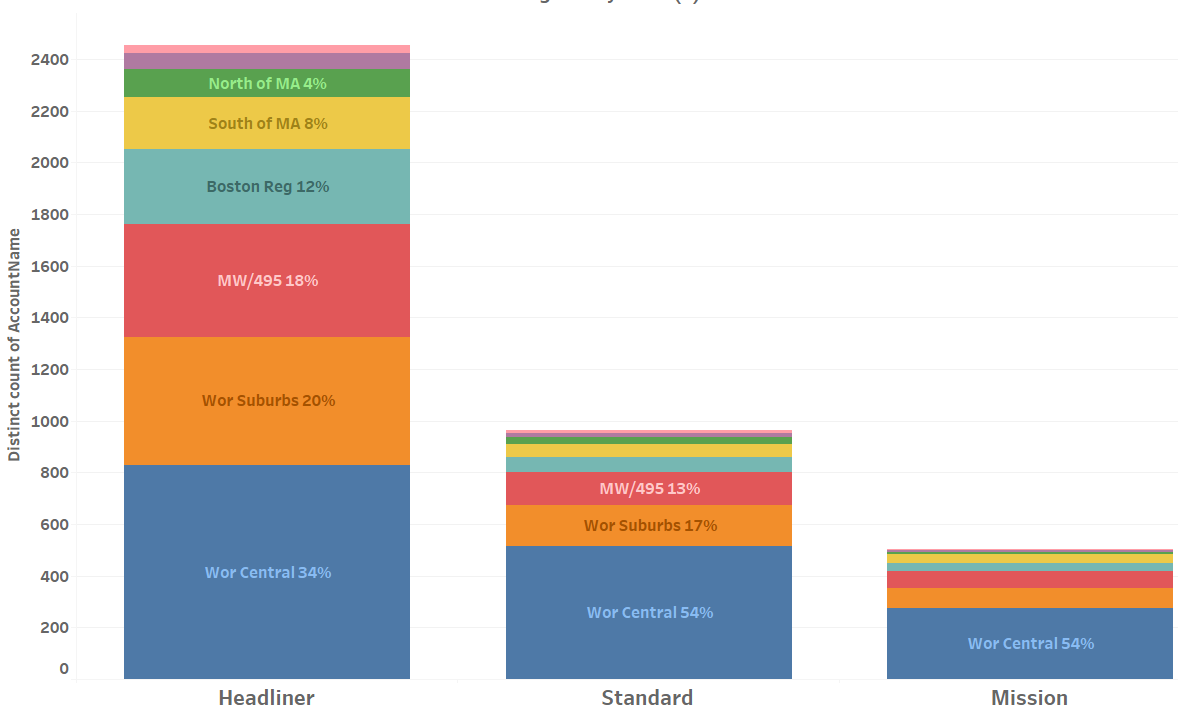
Map your audience by genre, headliner tier, and price band — see which events draw locally, which pull from neighboring metros, and where new audiences are showing up.

Result: A geographic profile for every program type — guiding where to advertise and where direct mail earns its postage.
Case Study 04

Are You Winning Patrons Faster Than You're Losing Them?

Retention & Cohort Tracking

Track new-patron return and year-over-year retention separately, by event type and genre. Acquisition health and retention health each get their own scorecard.

Result: Retention benchmarks you can hold yourself to — and a clear answer to whether the leak is bigger than the inflow.
Case Study 06

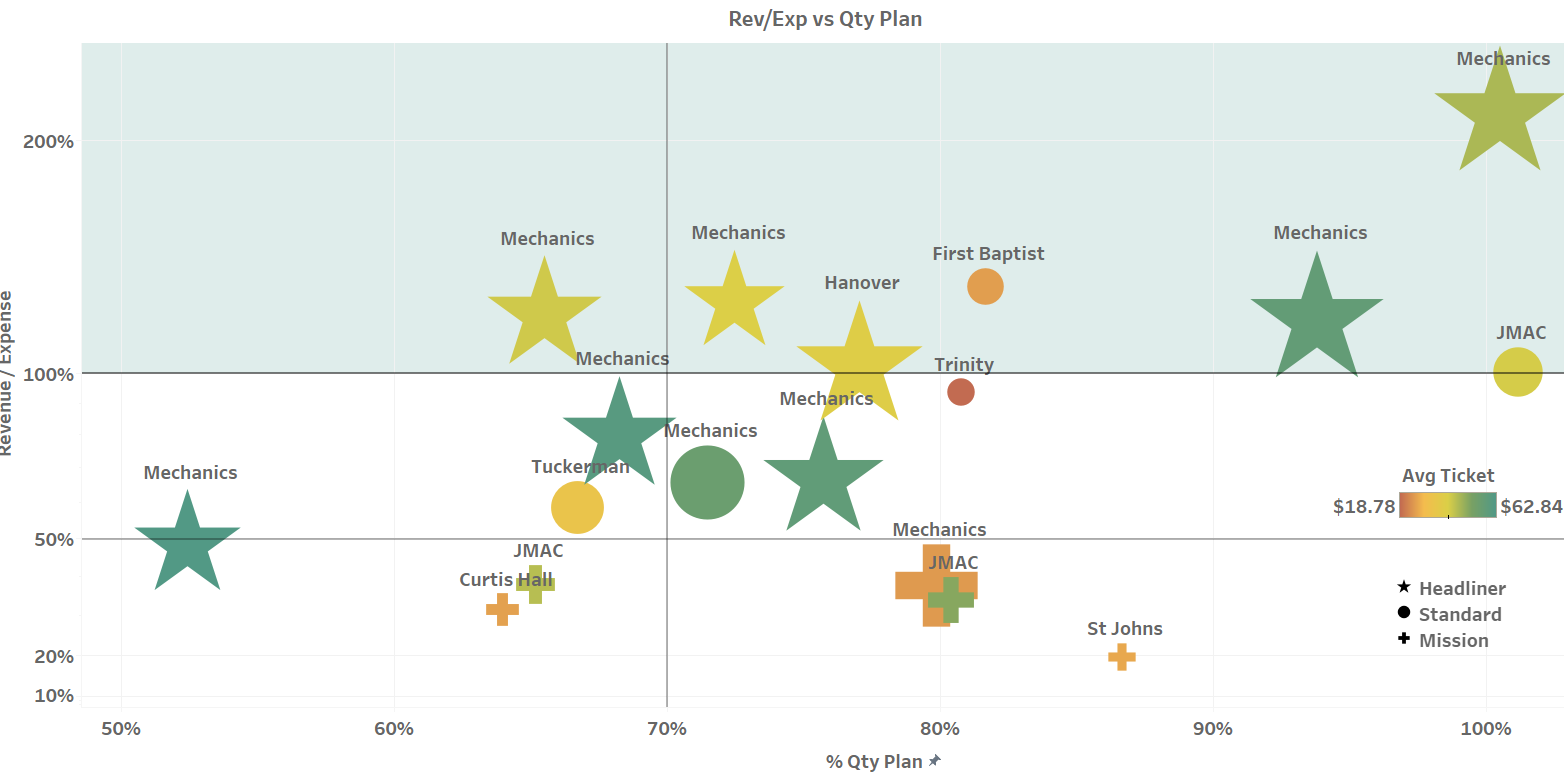
Know Which Events Earn, and Which Serve Mission

Event Performance · Programming Strategy

Genre-by-genre profit history plus a season quadrant placing every event by revenue coverage and capacity sold — mission and revenue events visible at a glance.

Result: Programming and sponsorship strategy grounded in evidence — easier to defend to boards and funders.
Case Study 07

Match the Message to the Patron, Not the Mailing List

Marketing · Channel Attribution

Targeting lists tied to lifecycle stage and event type. Acquisition and retention measured separately, with channel attribution showing what's actually working.

Result: Marketing spend shifts to channels that deliver, with messages matched to each patron's relationship stage.

Selected Sample Outputs

Patron lifecycle segments by event class
Lifecycle segments by event class. Headliners skew casual; mission events attract loyal Regulars.
Geographic mix by event class
Geography by event class. Headliners draw from distant suburbs and Boston; mission events stay local.
Season quadrant — revenue vs capacity by event
Season quadrant. Revenue/expense ratio vs. capacity plan — every event placed at a glance.

Services

  • Data integration & preparation
  • Patron lifecycle segmentation
  • Fundraising propensity scoring
  • Audience geography & mapping
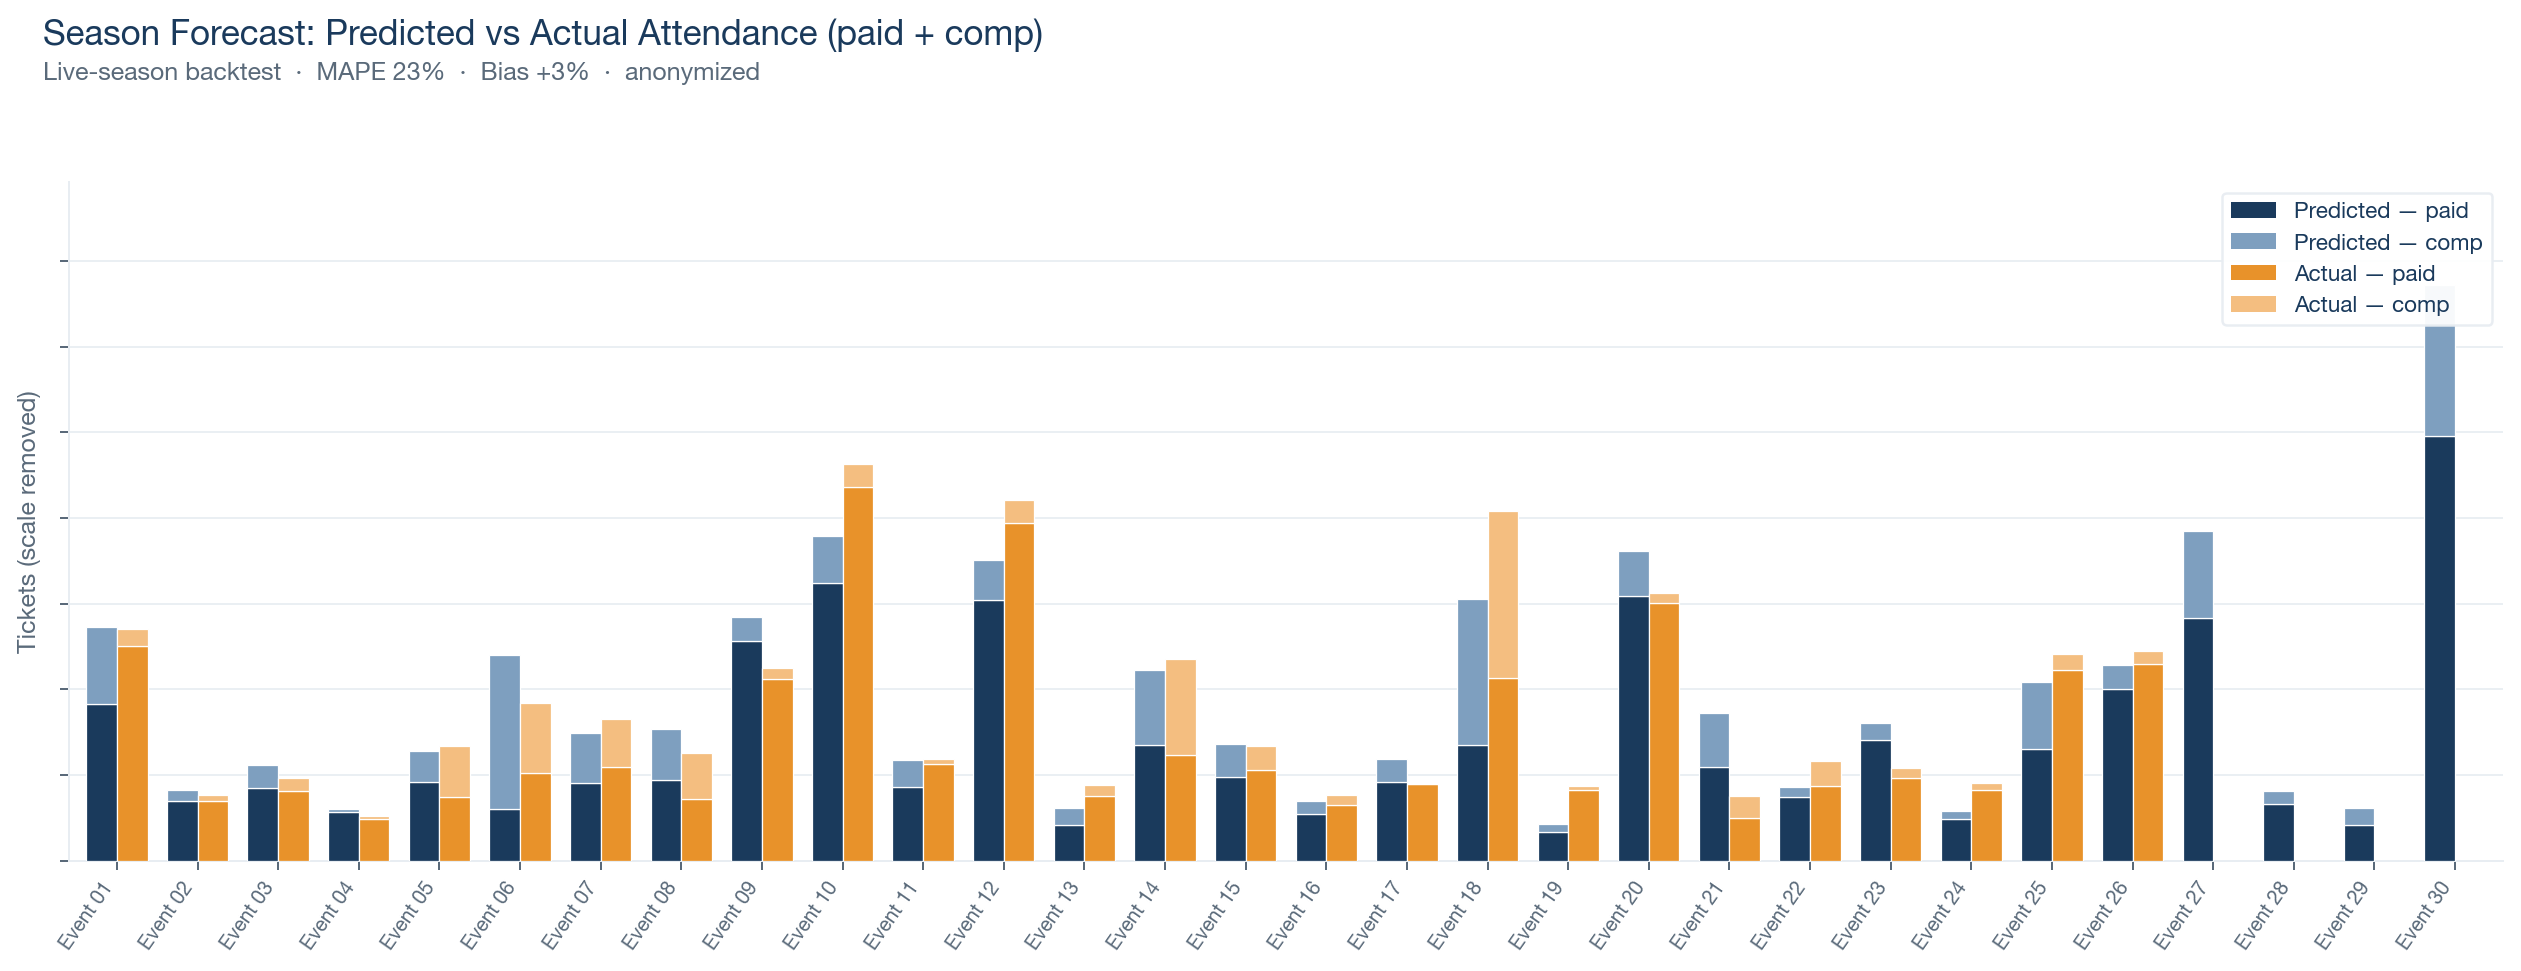
  • Event sales forecasting
  • Budget & season planning support
  • Retention & churn analysis
  • Marketing analytics
  • Campaign targeting & lists
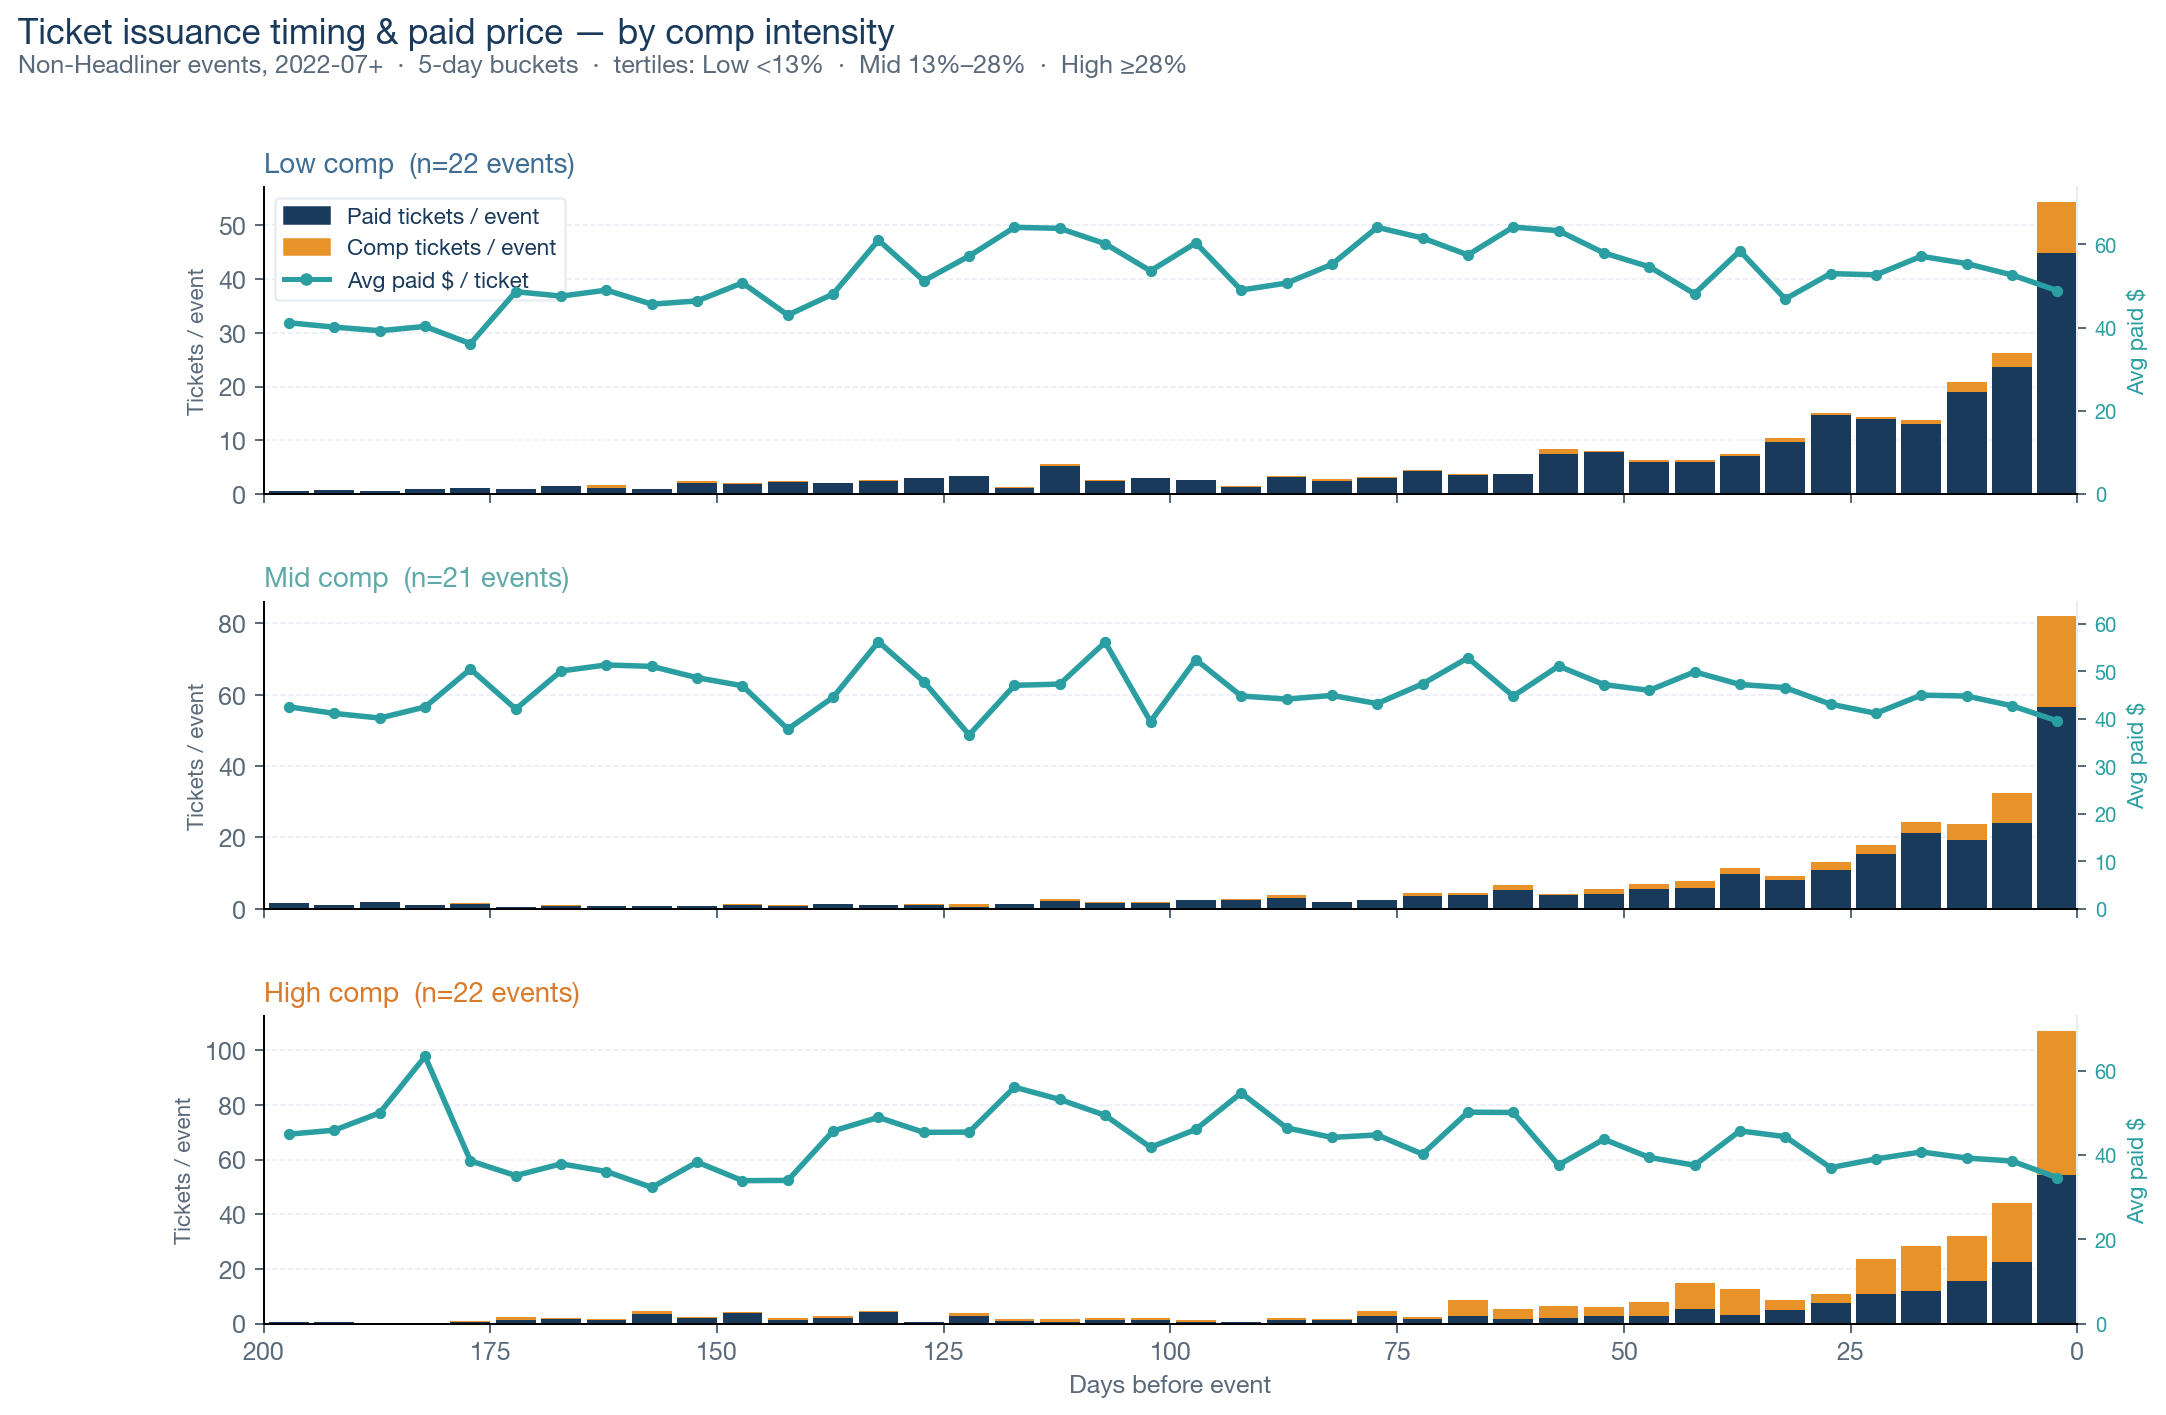
  • Pricing optimization
  • Pricing & loyalty strategy
  • Staff training & documentation

Our Approach

Data
Gathering
Integrate
& Prep
Model
& Score
Actionable
Results

We start with whatever systems you already have — no new software required — and end with outputs your staff can use on day one.

Nolichucky Associates

Forecasting · Budgeting · Planning

Forecasting in Practice

tony@nolichuckyassociates.com
nolichuckyassociates.com
linkedin.com/in/anthonymsmith
Case Study 05

Forecast Every Event — Before You Build the Budget

Attendance Forecasting · Season & Budget Planning

A predicted attendance for every event on next season's calendar — built from your own history. Each forecast comes with a likely range, not just a point. The same forecast supports three real decisions: annual budget submissions, season planning (how many events of each type, where to invest marketing), and event-level choices around capacity, comp strategy, and ticket-pricing tiers.

Result: A defensible attendance number for every event on the calendar — with mid-twenties typical accuracy and near-zero bias on a live season. Headliners, the events that drive budget swing, land tightest.
Live-season forecast vs actual, event by event
A live season, event by event. Predicted vs. actual attendance for every event on the calendar — each bar split into paid and complimentary tickets, so the forecast is judged against what really happened. Anonymized.
Ticket sales pace and average paid price by event type
Pricing patterns feed the forecast. Sales pace and average paid price differ sharply by event type and comp policy — structural patterns the forecast learns from, and a direct input into pricing decisions.